In the hyper-competitive arena of modern business, relying on historical data and intuition alone is like navigating a maze blindfolded. For decades, sales leaders have leaned on traditional dashboards that report on what happened—past quotas, closed deals, and historical trends. While useful, this rearview mirror approach is fundamentally reactive. It tells you where you’ve been, but offers little insight into the road ahead. The true competitive edge lies in knowing what will happen and, more importantly, how to influence it.

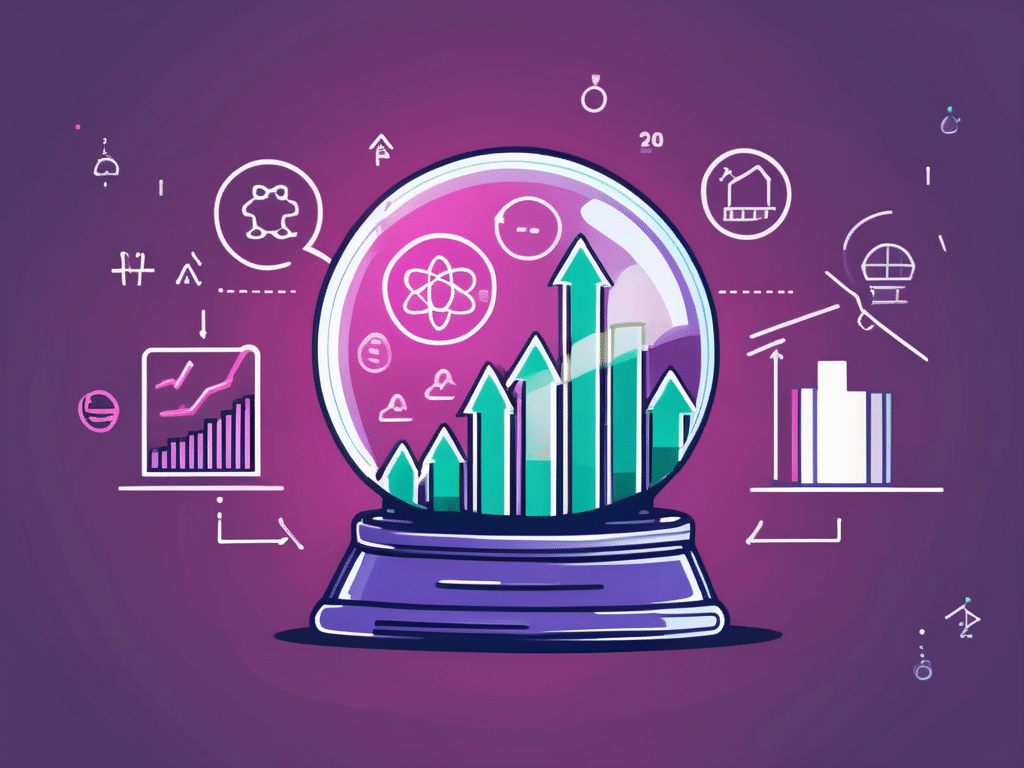
This is where the paradigm shifts. Enter the predictive sales dashboard, a sophisticated evolution of business intelligence that transforms your sales operation from a reactive team to a proactive, data-driven revenue engine. Powered by artificial intelligence (AI) and machine learning (ML), these dashboards don’t just display data; they interpret it, learn from it, and project future outcomes with astonishing accuracy. They are the crystal balls of modern commerce, enabling sales teams to identify the most promising leads, forecast revenue with confidence, prevent customer churn before it occurs, and optimize every step of the sales process.
This comprehensive guide will delve deep into the world of predictive sales dashboards. We will explore how they function, the transformative benefits they bring to businesses of all sizes, the critical metrics you must track, and the practical steps for implementation. Prepare to move beyond guesswork and unlock the future of your sales success.
Deconstructing the Magic: What Exactly Is a Predictive Sales Dashboard?
At its core, a predictive sales dashboard is an interactive, visual interface that displays forecasts and recommendations about future sales outcomes. Unlike its traditional counterpart, which presents descriptive analytics (e.g., “We sold 500 units last quarter”), a predictive dashboard offers predictive analytics (e.g., “We are projected to sell 620 units next quarter with an 85% confidence level, and here are the top 50 leads to target to meet that goal”).
Think of the difference between a photograph and a detailed weather forecast. A photograph (traditional dashboard) gives you a perfect, static image of a moment in time. A weather forecast (predictive dashboard) analyzes vast amounts of current and historical atmospheric data to tell you whether to expect sun, rain, or snow in the coming days, allowing you to prepare accordingly.
This predictive capability is not magic; it’s the product of sophisticated technology working in concert:
-
A. Data Aggregation: The process begins with data. Predictive models are only as smart as the information they are fed. A robust system pulls real-time and historical data from a multitude of sources within your business ecosystem. This includes your Customer Relationship Management (CRM) platform (like Salesforce or HubSpot), Enterprise Resource Planning (ERP) systems, marketing automation tools, customer support logs, website analytics, and even external data sources like social media trends or economic indicators.
-
B. Machine Learning Algorithms: This is the engine room. Once the data is aggregated and cleaned, machine learning algorithms are applied. These are complex mathematical models that are trained on your historical data to identify patterns, correlations, and causal relationships that are invisible to the human eye. For instance, an algorithm might discover that leads who download a specific whitepaper and visit the pricing page three times within a week have a 90% higher chance of converting. Common models include regression analysis for forecasting numerical values (like future revenue) and classification algorithms for predicting categories (like whether a lead will be “high-value” or “low-value”).
-
C. Artificial Intelligence (AI): AI takes machine learning a step further. While ML models are trained, AI allows the system to continuously learn and adapt as new data flows in. The AI refines the algorithms over time, making predictions progressively more accurate. It can test new hypotheses and adjust its own parameters without human intervention, ensuring the insights remain relevant in a changing market.
-
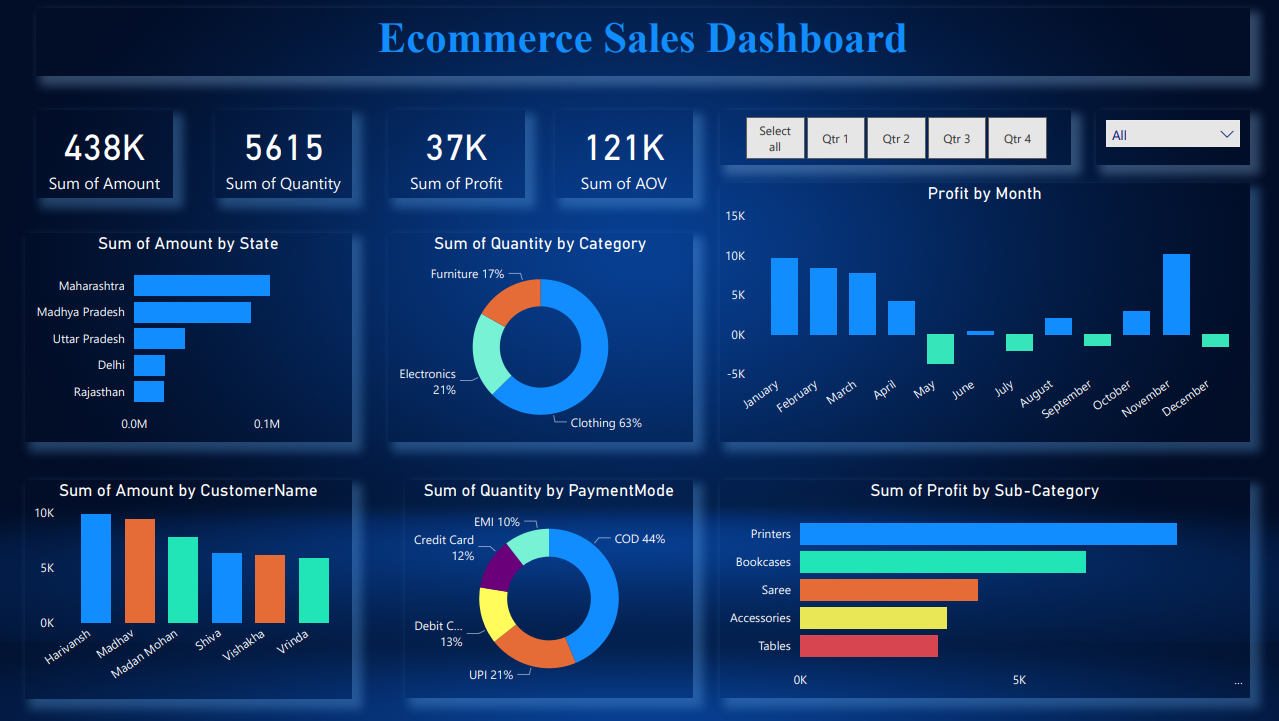
D. Advanced Data Visualization: All this complex computation would be useless if it weren’t presented in a clear, intuitive, and actionable way. The “dashboard” component uses advanced data visualization techniques—interactive charts, heat maps, probability gauges, and dynamic graphs—to translate complex predictions into easily digestible insights that a busy sales representative or manager can understand and act upon in seconds.
The Unfair Advantage: Transformative Benefits of Predictive Analytics
Integrating a predictive sales dashboard is not merely an upgrade; it’s a fundamental transformation of your entire sales philosophy. The benefits ripple across every facet of the sales organization, driving efficiency, morale, and, most importantly, revenue.
-
A. Hyper-Accurate Sales Forecasting: Say goodbye to “sandbagging” and overly optimistic projections based on gut feelings. Predictive forecasting analyzes the entire sales pipeline, scoring each deal’s probability of closing based on thousands of data points. This allows leadership to predict quarterly and annual revenue with a high degree of statistical confidence. This accuracy is invaluable for resource planning, inventory management, budgeting, and setting realistic expectations for stakeholders and investors.
-
B. Intelligent Lead and Opportunity Prioritization: Not all leads are created equal. A predictive dashboard uses a “predictive lead score” to rank every new and existing lead based on their likelihood to convert. It analyzes firmographic data (company size, industry), demographic data (job title), and behavioral data (website activity, email engagement). This empowers your sales team to stop wasting precious time on low-probability prospects and focus their energy and expertise exclusively on the leads that are most likely to become valuable customers, dramatically shortening the sales cycle and increasing win rates.
-
C. Proactive Customer Churn Reduction: Acquiring a new customer is exponentially more expensive than retaining an existing one. Predictive dashboards can be a company’s best defense against churn. By analyzing customer usage patterns, support ticket history, payment behavior, and engagement levels, the system can generate a “churn risk score” for each customer. It can flag at-risk accounts long before they decide to leave, allowing your customer success or sales teams to intervene with targeted support, special offers, or proactive communication to save the relationship.
-
D. Optimization of the Entire Sales Process: The dashboard provides a granular, data-backed view of your sales funnel, identifying both bottlenecks and best practices. You can answer critical questions like: At what stage do most deals stall? What sequence of sales activities leads to the fastest closes? Which marketing channels produce the leads with the highest lifetime value? These insights allow you to systematically refine your sales process, removing friction and replicating successful strategies across the entire team.
-
E. Enhanced and Personalized Customer Engagement: Generic sales pitches are dead. Predictive analytics can provide your sales reps with “Next Best Action” recommendations for each individual prospect. Based on the customer’s profile and recent activities, the dashboard might suggest sending a specific case study, scheduling a demo of a particular feature, or making a call at an optimal time. This level of personalization makes the prospect feel understood and significantly increases the chances of a positive response.
-
F. Data-Driven Performance Management and Coaching: Sales managers can transition from being taskmasters to strategic coaches. Instead of simply looking at who hit their quota, managers can use the dashboard to see why certain reps are succeeding or struggling. Is a rep great at opening deals but poor at closing? Is another spending too much time on low-value leads? The dashboard provides objective, specific data points that form the basis for targeted, effective coaching and training, boosting the performance of the entire team.
Building Your Cockpit: Essential Metrics for a Predictive Dashboard
A powerful dashboard is defined by the quality and relevance of its metrics. While the specifics can be tailored to your industry, a world-class predictive sales dashboard should prominently feature these key performance indicators (KPIs):
-
A. Predictive Lead Score: Often a numerical value (e.g., 1-100), this score represents the calculated probability that a lead will convert into a paying customer. This should be the primary metric guiding a sales rep’s daily priorities.
-
B. Deal Win Probability: Displayed as a percentage for each open opportunity in the pipeline, this metric goes beyond the simple sales stage. It calculates the real-time chance of a deal closing based on factors like deal size, engagement level, and the historical success rate with similar opportunities.
-
C. Forecasted Revenue (with Confidence Score): The top-line prediction of future revenue for a given period (month, quarter). Crucially, this should be accompanied by a confidence score (e.g., 87% confident) to provide context on the forecast’s reliability.
-
D. Predicted Sales Cycle Length: An estimation of how many days or weeks a new lead or opportunity is expected to take to move through the entire sales funnel. This is vital for managing cash flow and setting realistic timelines.
-
E. Customer Churn Risk Score: A “health score” for each existing customer, typically color-coded (e.g., green, yellow, red) to instantly identify accounts that are at risk of leaving.
-
F. Predicted Customer Lifetime Value (CLV): A forecast of the total revenue a business can expect from a single customer account throughout the business relationship. This helps in identifying high-value customer segments and justifying marketing spend.
-
G. Next Best Action Recommendations: This isn’t a traditional metric but a dynamic suggestion field. For any given lead or customer, the AI should recommend the single most impactful action the rep can take next to move the deal forward or improve the relationship.
Implementation Pathways: The Build vs. Buy Decision
Once you’re convinced of the power of predictive analytics, the next logical step is implementation. This typically leads to a critical strategic decision: should you build a custom solution in-house or buy a pre-built, third-party platform?
-
A. Building a Custom Predictive Dashboard:
- Pros: The primary advantage is complete customization. The dashboard can be tailored precisely to your unique business processes, data structures, and specific analytical needs. You have full ownership and control over the intellectual property.
- Cons: This path is fraught with challenges. It is incredibly expensive, requiring a significant upfront investment in hiring a team of data scientists, data engineers, and software developers. The development timeline can stretch from many months to over a year. Furthermore, the burden of ongoing maintenance, updates, and model refinement falls entirely on your shoulders. For most small and medium-sized businesses, this is not a feasible option.
-
B. Buying an Off-the-Shelf Solution:
- Pros: This is the most common and practical approach. The market is now rich with sophisticated SaaS (Software as a Service) platforms that specialize in predictive sales analytics. These tools offer rapid deployment, often integrating seamlessly with popular CRMs in a matter of hours or days. They benefit from the collective intelligence of serving thousands of customers, meaning their AI models are often more mature and powerful. They also handle all the backend complexity, maintenance, and updates for a predictable subscription fee.
- Cons: The main drawback is a potential lack of perfect customization. While most platforms offer significant configuration options, they may not cater to every single niche requirement of your business. You are also dependent on the provider’s roadmap for new features and integrations.
When choosing a platform, prioritize solutions that offer seamless integration with your existing CRM, an intuitive and user-friendly interface that your sales team will actually want to use, and the scalability to grow with your business.
Navigating the Hurdles: Overcoming Implementation Challenges
Deploying a predictive sales dashboard is not a simple plug-and-play affair. To ensure a successful rollout and widespread adoption, businesses must proactively address several common challenges:
-
A. Data Quality and Accessibility: Predictive models are based on the principle of “garbage in, garbage out.” If your source data in your CRM is incomplete, inconsistent, or inaccurate, the predictions will be flawed. Before implementation, conduct a thorough data audit and cleaning process. Break down data silos between departments (sales, marketing, support) to create a single, unified view of the customer.
-
B. Fostering User Adoption and Trust: The most significant barrier is often cultural, not technical. Salespeople, especially veterans, may be skeptical of a machine telling them how to do their job. It’s crucial to frame the dashboard not as a “big brother” tool for micromanagement, but as a powerful assistant designed to make their jobs easier and more lucrative. Comprehensive training, demonstrating early wins, and involving key sales leaders in the selection process are vital for building trust and encouraging adoption.
-
C. Ensuring Seamless Technical Integration: The predictive tool must communicate flawlessly with your other systems, especially your CRM. A clunky or unreliable integration will doom the project from the start. Verify the technical capabilities of any vendor and, if possible, run a pilot program with a small group of users to iron out any technical kinks before a full-scale launch.
The Future is Now
The era of reactive, intuition-based selling is drawing to a close. The market leaders of tomorrow will be those who harness the power of their data to not only understand the present but also to accurately predict and shape the future. A predictive sales dashboard is no longer a luxury reserved for tech giants; it is an accessible and essential tool for any business serious about sustainable growth.
By embracing this technology, you empower your sales team to work smarter, not just harder. You provide them with the clarity to focus on what matters, the foresight to act before it’s too late, and the intelligence to personalize every interaction. It’s a strategic shift from chasing deals to architecting revenue, ensuring that your business is not just surviving, but thriving in the data-driven age.